Inspecting the Data from MIMIC-IV dataset
We begin by loading and inspecting the required data from MIMIC-IV:
# load the mortality data <- id_col (load_concepts ("adm_episode" , "miiv" , verbose = FALSE )[adm_episode == 1 ])<- load_concepts (c ("acu_24" , "diag" , "age" , "sex" , "charlson" ,"lact_24" , "pafi_24" , "ast_24" ,"race" , "death" ), "miiv" , patient_ids = patient_ids,verbose = FALSE )<- dat[race %in% c ("Caucasian" , "African American" )]c (index_var (dat)) : = NULL ]<- list (age = 65 ,acu_24 = 0 ,charlson = 0 ,lact_24 = 1 ,ast_24 = 20 ,pafi_24 = 500 ,death = FALSE for (i in seq_len (ncol (dat))) {<- names (dat)[i]if (any (is.na (dat[[var]])) & ! is.null (imp_lst[[var]]))is.na (get (var)), c (var) : = imp_lst[[var]]]:: kable (head (dat), caption = "MIMIC-IV Mortality data." )
MIMIC-IV Mortality data.
30000153
3
TRAUM
61
Male
0
1.7
430.0000
20
Caucasian
FALSE
30001396
3
MED
40
Male
1
1.8
361.9048
23
Caucasian
FALSE
30001446
11
MED
56
Male
1
1.7
466.6667
114
Caucasian
FALSE
30001656
3
NMED
68
Female
0
1.0
500.0000
20
Caucasian
FALSE
30001947
2
SURG
43
Male
1
0.7
535.0000
36
Caucasian
FALSE
30002415
4
CSURG
72
Female
0
1.0
240.0000
20
Caucasian
FALSE
We consider the cohort of all patients in the database admitted to the ICU (and we only consider the first admission of each patient). We also load information on the SOFA score, admission diagnosis, age, sex, Charlson comorbidity index, worst values of lactate, PaO2/FiO2, and AST in first 24 hours. We further load the race information (protected attribute \(X\) ) and the death indicator (outcome \(Y\) ). We want to investigate the disparities in outcome between "Caucasian" and "African American" groups.
Constructing the SFM
We next construct the Standard Fairness Model, with also a decision \(D\) :
# constructing the SFM <- "race" <- c ("age" , "sex" )<- c ("acu_24" , "diag" , "charlson" , "lact_24" , "pafi_24" , "ast_24" )<- "death"
Decomposing the Disparity
<- fairness_cookbook (data = dat, X = X, Z = Z, W = W, Y = Y,x1 = "Caucasian" , x0 = "African American"
2.10843373493976% of extreme P(x | z) or P(x | z, w) probabilities.
Estimates likely biased.
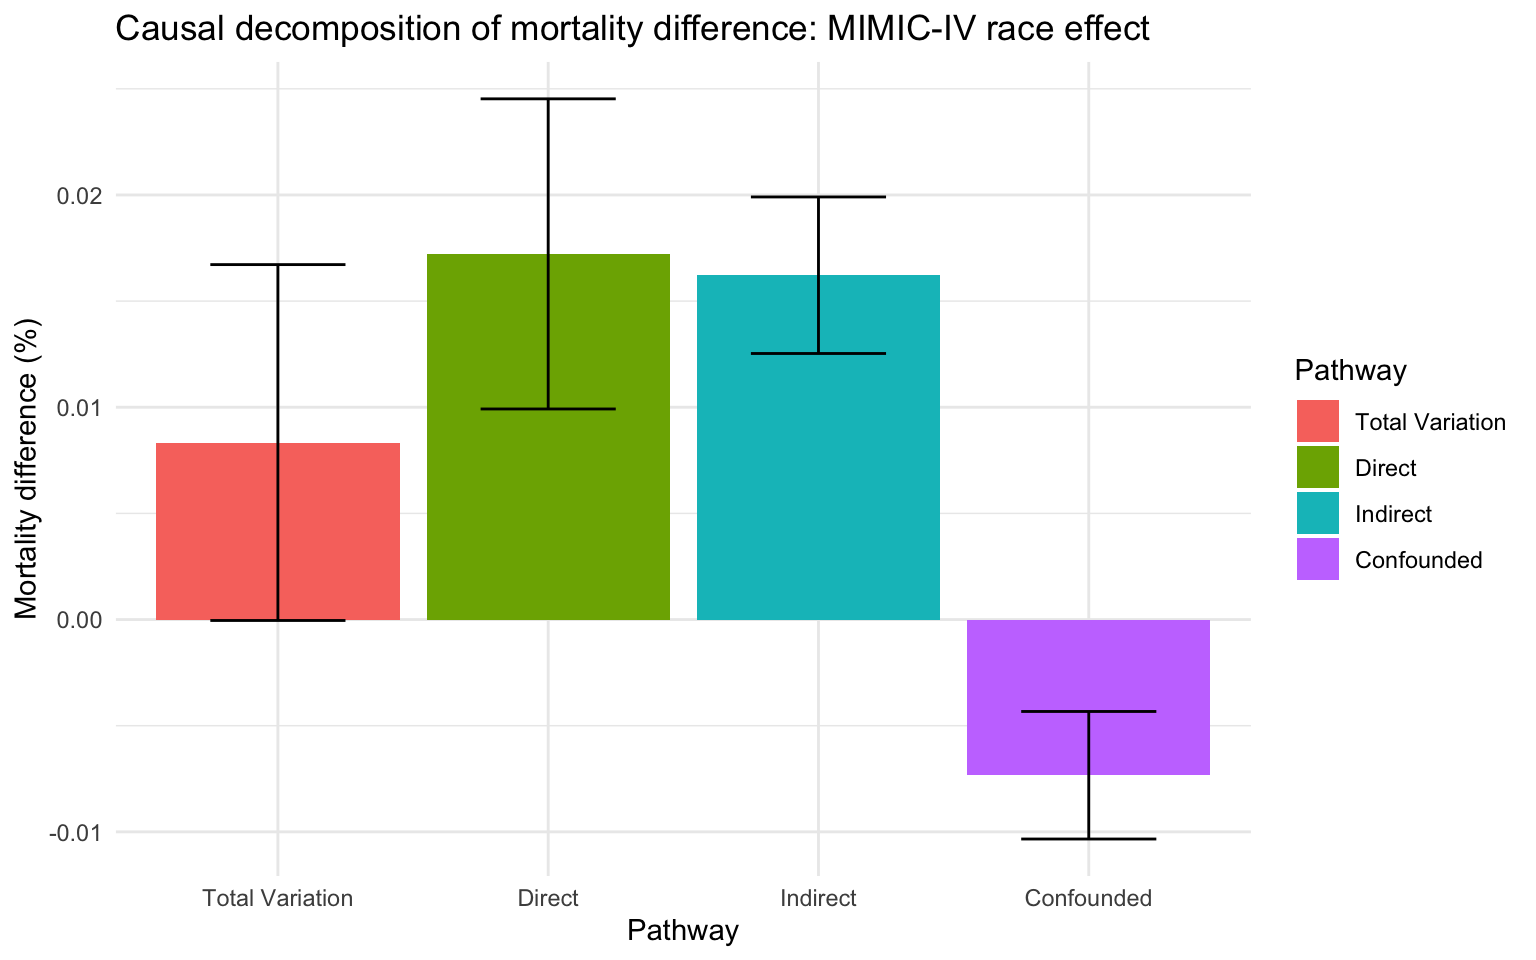
We can then inspect the decomposition by calling autoplot() on the fcb object which is an S3 class of type faircause:
autoplot (fcb) + labs (title= "Causal decomposition of mortality difference: MIMIC-IV race effect" ,y= "Mortality difference (%)" ) + theme_minimal () + scale_x_discrete (labels = c ("Total Variation" , "Direct" , "Indirect" ,"Confounded" ), name = "Pathway" ) + scale_fill_discrete (labels = c ("Total Variation" , "Direct" , "Indirect" ,"Confounded" ), name = "Pathway" )
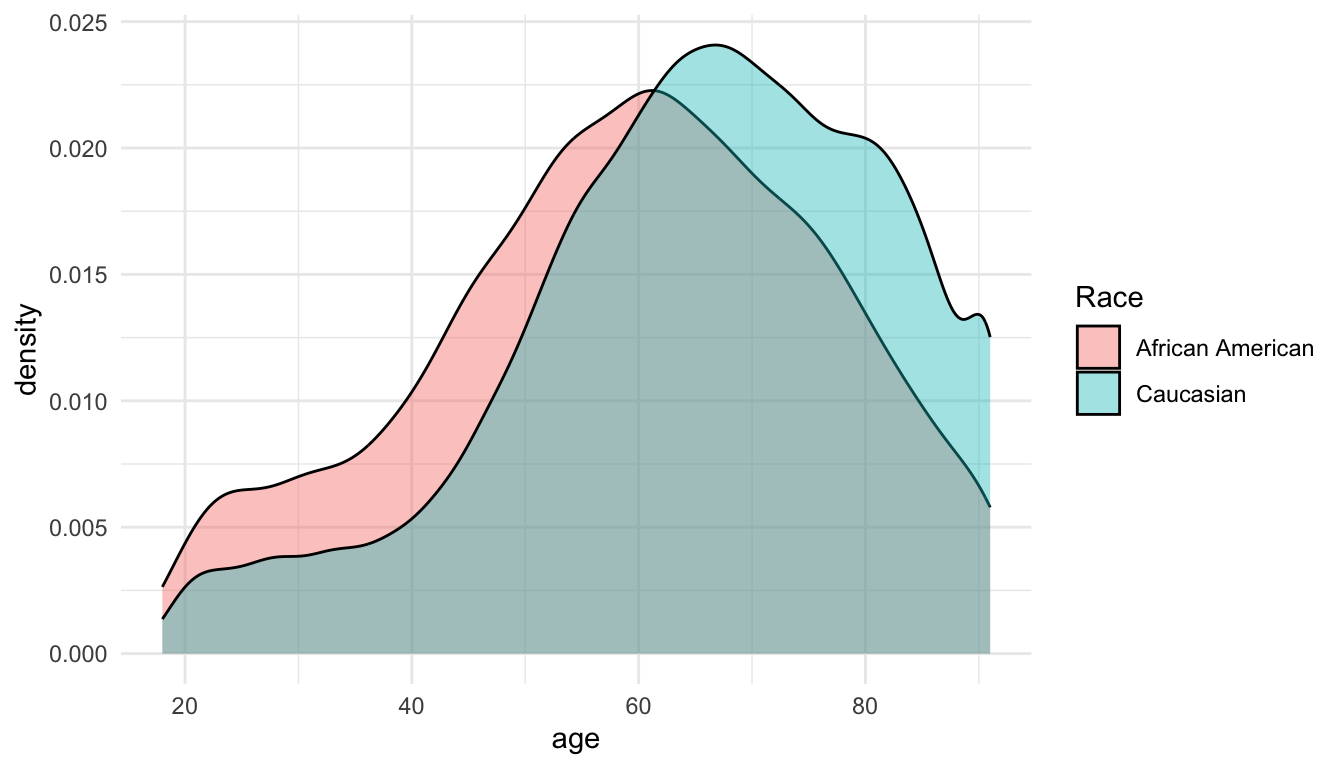
Zooming-in on the Spurious Effect
To better understand the spurious effect, we plot the density of the age distributions between groups: